
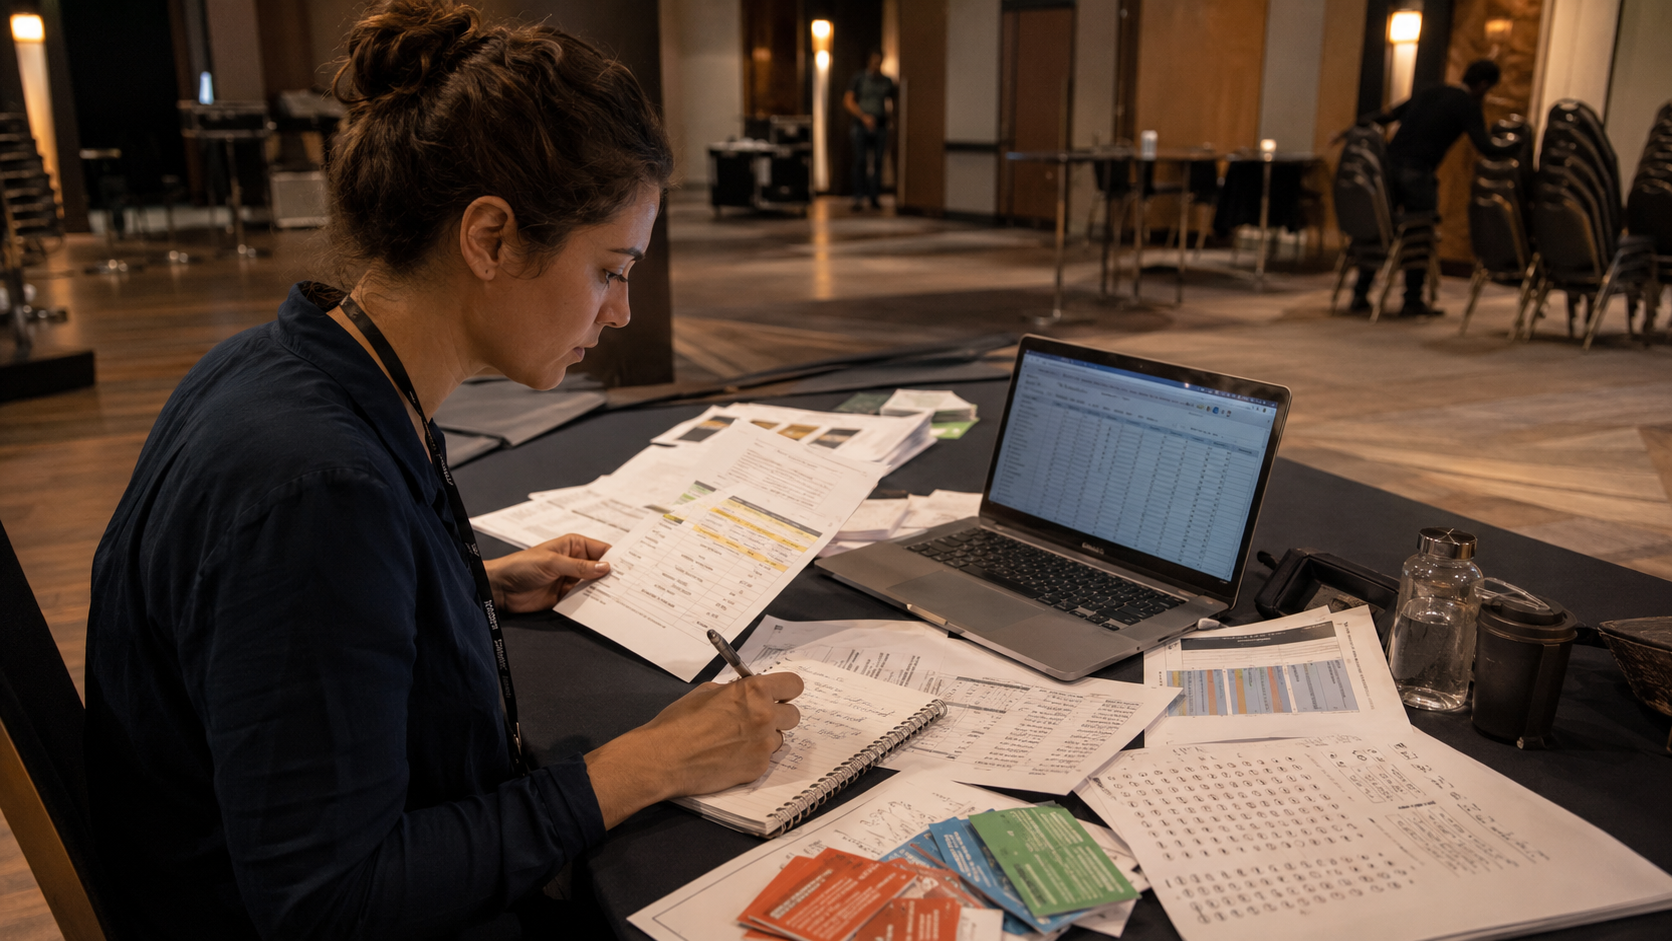
The day after an event is a weird mix of relief and dread.
Relief: it happened. Nobody set the venue on fire. The keynote showed up.
Dread: someone asks, “So… was it successful?”
And suddenly you’re hunting through tabs, email threads, a check-in app, a survey tool, and a spreadsheet called FINAL_FINAL_v7.
Most post-event reporting isn’t hard because the numbers don’t exist. It’s hard because nobody agreed what “success” meant until the event was already over.
The usual reporting trap: counting what’s easy, not what matters
A lot of event reports accidentally become a list of available metrics.
- Registrations (because the registration tool has it)
- Attendance (sort of… depending on how check-in was handled)
- NPS (because the survey platform has a template)
- Social reach (because someone found a hashtag counter)
None of these are useless.
But if you can’t explain how those numbers connect to what the event was supposed to achieve, you’ll still end up defending the event with vibes.
First: do you actually know what “success” entails?
Here’s a blunt but helpful test.
If someone asked you on event day, “What would make you proud of this event?” would you answer with:
- a number (e.g., 300 attendees checked in),
- a behavior (e.g., people actually stayed for the workshops),
- an outcome (e.g., participants made contacts and booked follow-ups),
- or a feeling (e.g., “it went well”)?
Feelings matter. They just don’t survive procurement.
So before you touch a spreadsheet, pick one or two success statements that are specific enough to measure.
Examples that don’t collapse under pressure
- Content success: “Most attendees rated sessions 4/5 or higher, and we can point to the best sessions by track.”
- Operational success: “Check-in didn’t create queues, and we can show check-in volume over time.”
- Participation success: “A meaningful portion of attendees engaged beyond sitting in a chair (missions, quizzes, feedback, store redemptions).”
- Sponsor success: “Sponsors were visible in the event experience, and we can show sponsor interactions and actual attendance.”
Notice what’s missing: “We had a lot of engagement.” (What does that mean? Applause?)
The real reason reporting becomes a mess: your event data lives in five places
Reporting is painful when the event story is fragmented:
- Attendance is in the check-in system.
- Session satisfaction is in a survey tool.
- Participation is in an event app.
- Payments are in Stripe.
- Someone “helpfully” tracked VIPs in a separate sheet.
Then you spend your post-event week doing data archaeology:
- export
- clean
- deduplicate
- match columns
- argue about which list is real
That’s how you end up with a spreadsheet hangover.
What to pull while the event is still fresh (and why)
The best time to capture your metrics is during the event and immediately after.
Not because you love working during events (nobody does), but because:
- people still remember sessions clearly, so feedback is better,
- your team still remembers what changed last-minute,
- check-in data hasn’t been “fixed” in three different files,
- you can still act on what you learn (even if it’s just day 2).
1) Check-ins (the reality check)
Registrations are a promise. Check-ins are what actually happened.
If you can’t trust your attendance number, everything else becomes a debate.
- How many participants checked in overall?
- How did check-in volume look over time (did you create a 9:00am queue)?
- Which sessions had check-ins (not just sign-ups)?
In Bewitt, organizers can use event and agenda-item QR check-ins and review scan activity, so you’re not reconstructing attendance from a staff member’s memory and a half-filled clipboard.
2) Session ratings and comments (while people still remember)
Session feedback collected two weeks later mostly measures inbox guilt.
Session feedback collected right after the session measures the session.
- Average rating per session
- Number of ratings per session (a 5.0 from two people is… not a victory lap)
- Common themes in comments (what to repeat, what to stop doing)
In Bewitt, participants can rate and comment on sessions, and organizers can review feedback and export comments/ratings when it’s time to write the report.
3) Quiz participation (who leaned in)
Quizzes are useful because they show active participation.
- How many participants answered?
- Which questions had the most drop-off?
- Did people participate across the day or only when prompted?
If your event has learning goals (training, workshops, internal rollouts), this is a practical signal that goes beyond “they attended.”
4) Mission completions and badges (what people actually did)
If you set missions like “visit sponsor booths”, “complete your profile”, or “check into two sessions”, you’re basically defining success behaviors upfront.
- Mission completion counts
- Points issued (and why)
- Which missions were ignored (often a hint that instructions weren’t clear)
Bewitt tracks missions, achievements/badges, and point transactions, which makes it easier to show participation as a set of real actions.
5) Rewards redemptions (proof that points meant something)
If you run a rewards store, redemptions are a clean indicator:
- People understood the system
- They cared enough to use it
- Onsite fulfillment worked (or didn’t)
In Bewitt, redemptions can be points-based, money-based (with Stripe checkout), or mixed—and organizers can see redemption history and sales ledger entries for store transactions.
A report that says “people engaged” is nice. A report that says “312 participants completed missions and 184 redeemed rewards” is harder to dismiss.
A simple “success metrics” plan you can steal
Before the event starts, write this on one page and share it with anyone who might later ask for results.
Step 1: Choose 3 categories
- Attendance: who showed up?
- Content: what landed well?
- Participation: what did people actually do?
Step 2: Pick 2 metrics per category
- Attendance: total check-ins; check-ins by time window
- Content: average session rating; top/bottom 5 sessions by rating (with sample size)
- Participation: quiz participants; mission completions; store redemptions
Step 3: Decide what “good” looks like
Not perfect. Just decided.
- “We want at least 70% of registered participants to check in.”
- “We want an average session rating above 4.2 with at least 30 ratings for key sessions.”
- “We want 40% of attendees to complete at least one mission.”
Now you can report against a plan instead of improvising.
Where Bewitt helps (specifically, without making you a data mover)
If you run registrations, agenda, check-ins, feedback, quizzes, missions, and rewards through different systems, reporting becomes a reconciliation project.
Bewitt keeps a lot of the operational event activity tied to the same event:
- Check-ins: event and session check-in QR codes, scan activity, and counts
- Feedback: per-session ratings and comments, organizer review, exports
- Quizzes: participation and results tied to the event
- Gamification: missions, badges, triggers, and point transactions
- Rewards store: redemption history and sales ledger for store purchases
- Performance dashboard: totals across participants, invites, agenda, check-ins, questions, feedback, missions, and redemptions
The practical win is not “more analytics.”
It’s fewer exports, fewer mismatched lists, and less time arguing about what really happened.
The goal: tell the story of the event while it’s still true
A good post-event report isn’t a victory parade. It’s a clear record.
What happened. What worked. What didn’t. What you’ll do next time.
And ideally, it doesn’t require three late nights and a spreadsheet hangover to produce.